Hello CUDA!
Learn about GPU architecture and the CUDA model to understand how parallel hardware operates and optimize performance.
Introduction#
If you work in AI, Data Science, or High-Performance Computing (HPC), you've undoubtedly heard of CUDA. It's NVIDIA's platform and programming model that allows us to harness the power of thousands of "cores" inside a GPU.
The explosive rise of AI, especially Deep Learning, is intrinsically linked to this massive parallel processing capability.
But CUDA isn't just an API. It's a new perspective on algorithm design. A classic example: thrust::sort (a CUDA library) in large workloads with linear memory access can be tens to hundreds of times faster than the traditional std::sort running on a CPU, depending on the architecture and data.
Why such a massive difference? Because we are redesigning the algorithm to fit how the hardware operates.
Inspiration from FlashAttention#
One of the biggest inspirations recently comes from Tri Dao and the FlashAttention paper. Before it, the AI community believed the bottleneck of Transformers (like GPT) was compute-bound, i.e., the operations of self-attention.
Tri Dao showed that the real bottleneck was actually memory bandwidth, not compute as many had thought.
The problem wasn't that the GPU was slow at calculating matrix multiplications (FLOPs). The problem was that reading and writing the enormous Q, K, V matrices constantly from Global Memory (HBM) to SRAM (super-fast on-chip memory) took too much time.
FlashAttention's solution is Kernel Fusion. Instead of running multiple separate kernels (one for , one for , one for ) and writing intermediate results to Global Memory each time, FlashAttention performs the entire chain of operations in a single kernel. It uses SRAM/Shared Memory as a cache to hold data, minimizing Global Memory accesses.
The result was a 2-3x speedup in GPT-2 training.
This story is the perfect testament: to optimize GPU performance, you must understand its hardware and memory system.
What is CUDA?#
CUDA is a programming model that enables developers to harness and manage the massive parallelism of modern hardware. To think and program effectively in CUDA, one needs to understand three key aspects: Hardware, Execution Model, and Memory.
1. Hardware#
What are we programming for?
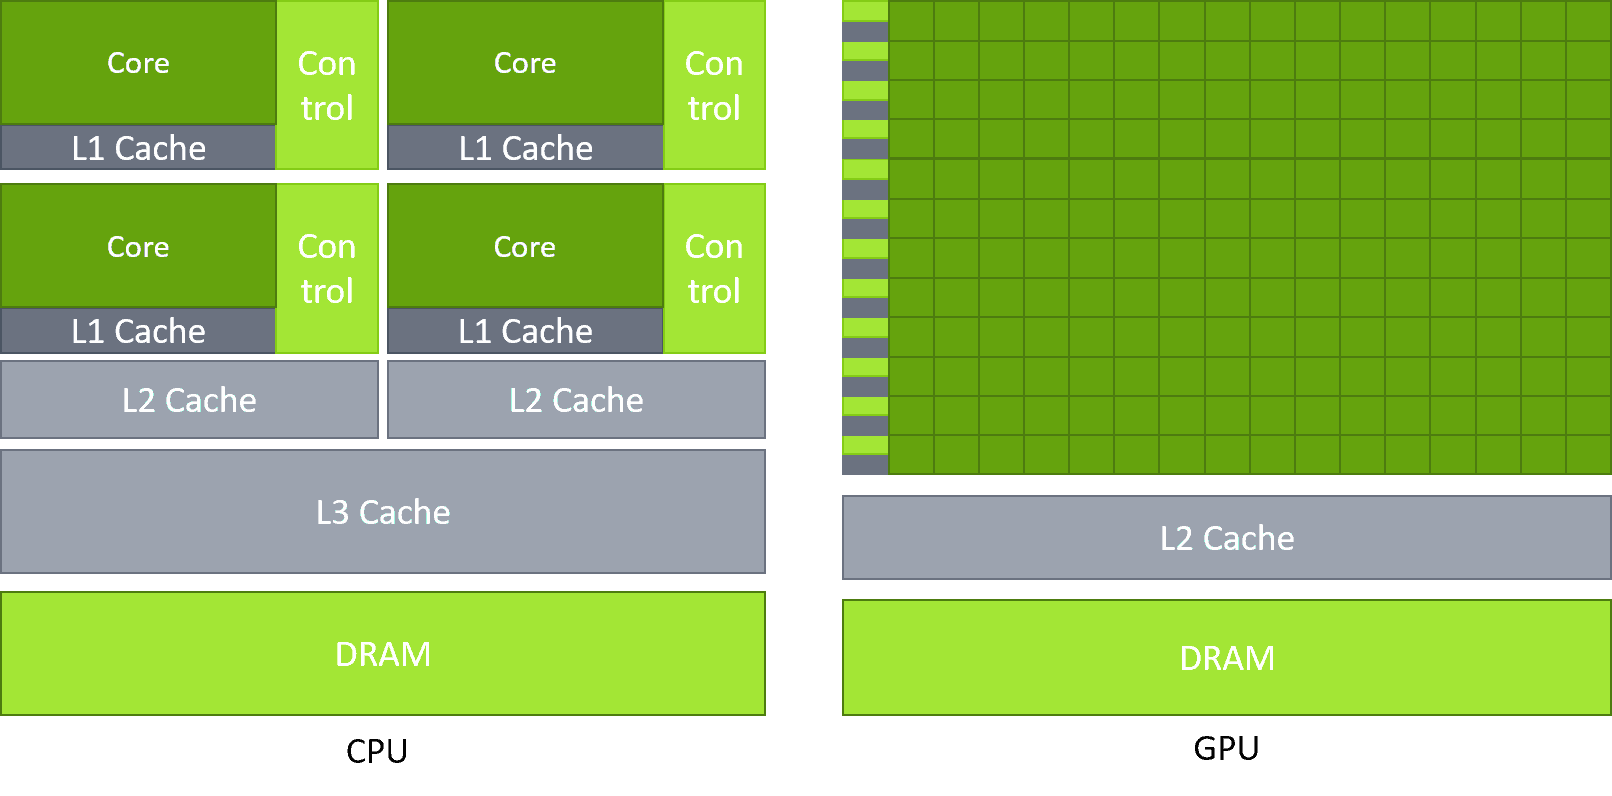
- CPU (Central Processing Unit): Designed for low latency. It has a few "cores" that are super-smart, powerful, and can handle complex tasks sequentially or with small-scale parallelism.
- GPU (Graphics Processing Unit): Designed for high throughput. It has thousands of simpler "CUDA cores" specialized for performing the same operation on thousands of different pieces of data at the same time.
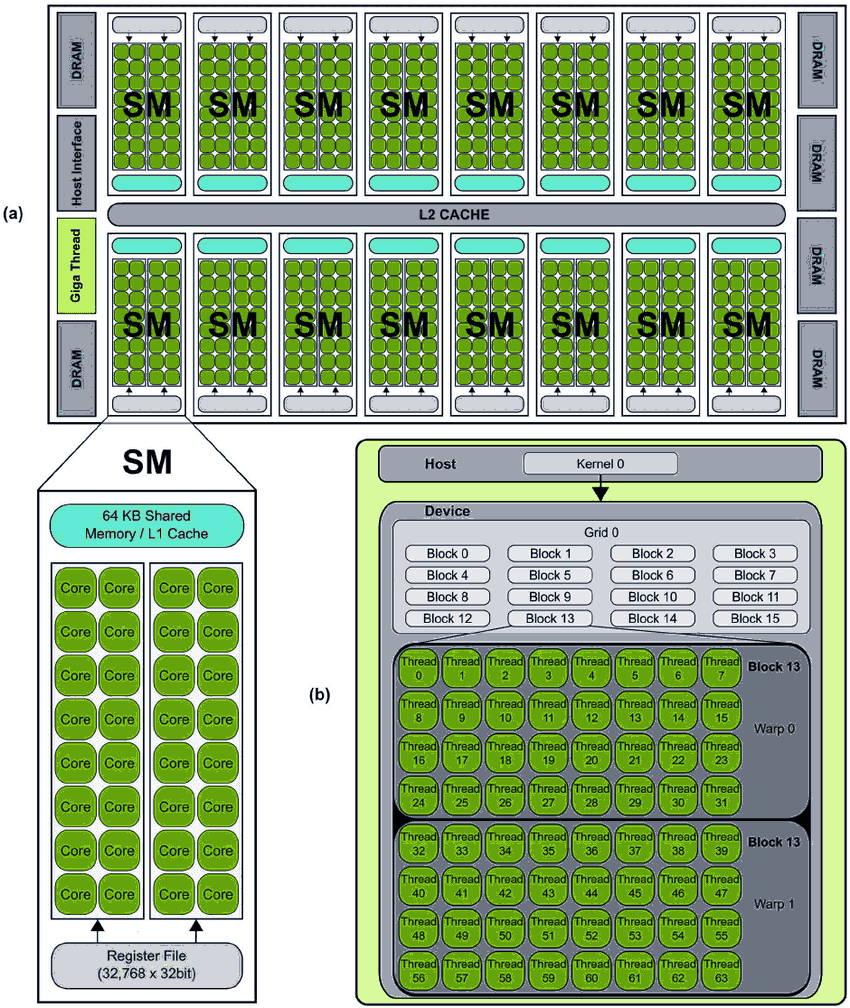
The main execution unit on the GPU is the SM (Streaming Multiprocessor). This is the "heart" of the GPU. Each SM contains a number of CUDA cores (e.g., 128 cores).
So where does the parallelism come from?
- Warp: A group of 32 threads. This is the scheduling unit of the SM.
- Latency Hiding: An SM simultaneously manages many warps (e.g., 64 resident warps). At each clock cycle, the SM's Warp Scheduler selects one (or several) warps that are "ready" to be executed by the CUDA cores.
- Scenario: Warp 1 performs an operation, then needs to read data from Global Memory (very slow, hundreds of cycles). Instead of "sitting and waiting", the SM immediately (with a zero-cost context switch) switches to executing Warp 2 (which is doing an addition). The next cycle, if Warp 2 also has to wait, it switches to Warp 3... And so on, the SM cycles through dozens of warps. By the time it gets back to Warp 1, the data from Global Memory has likely arrived. 1
Note: Most CUDA performance optimizations revolve around the behavior of the 32 threads within a warp.
2. Execution Model: Grid, Block, Thread#
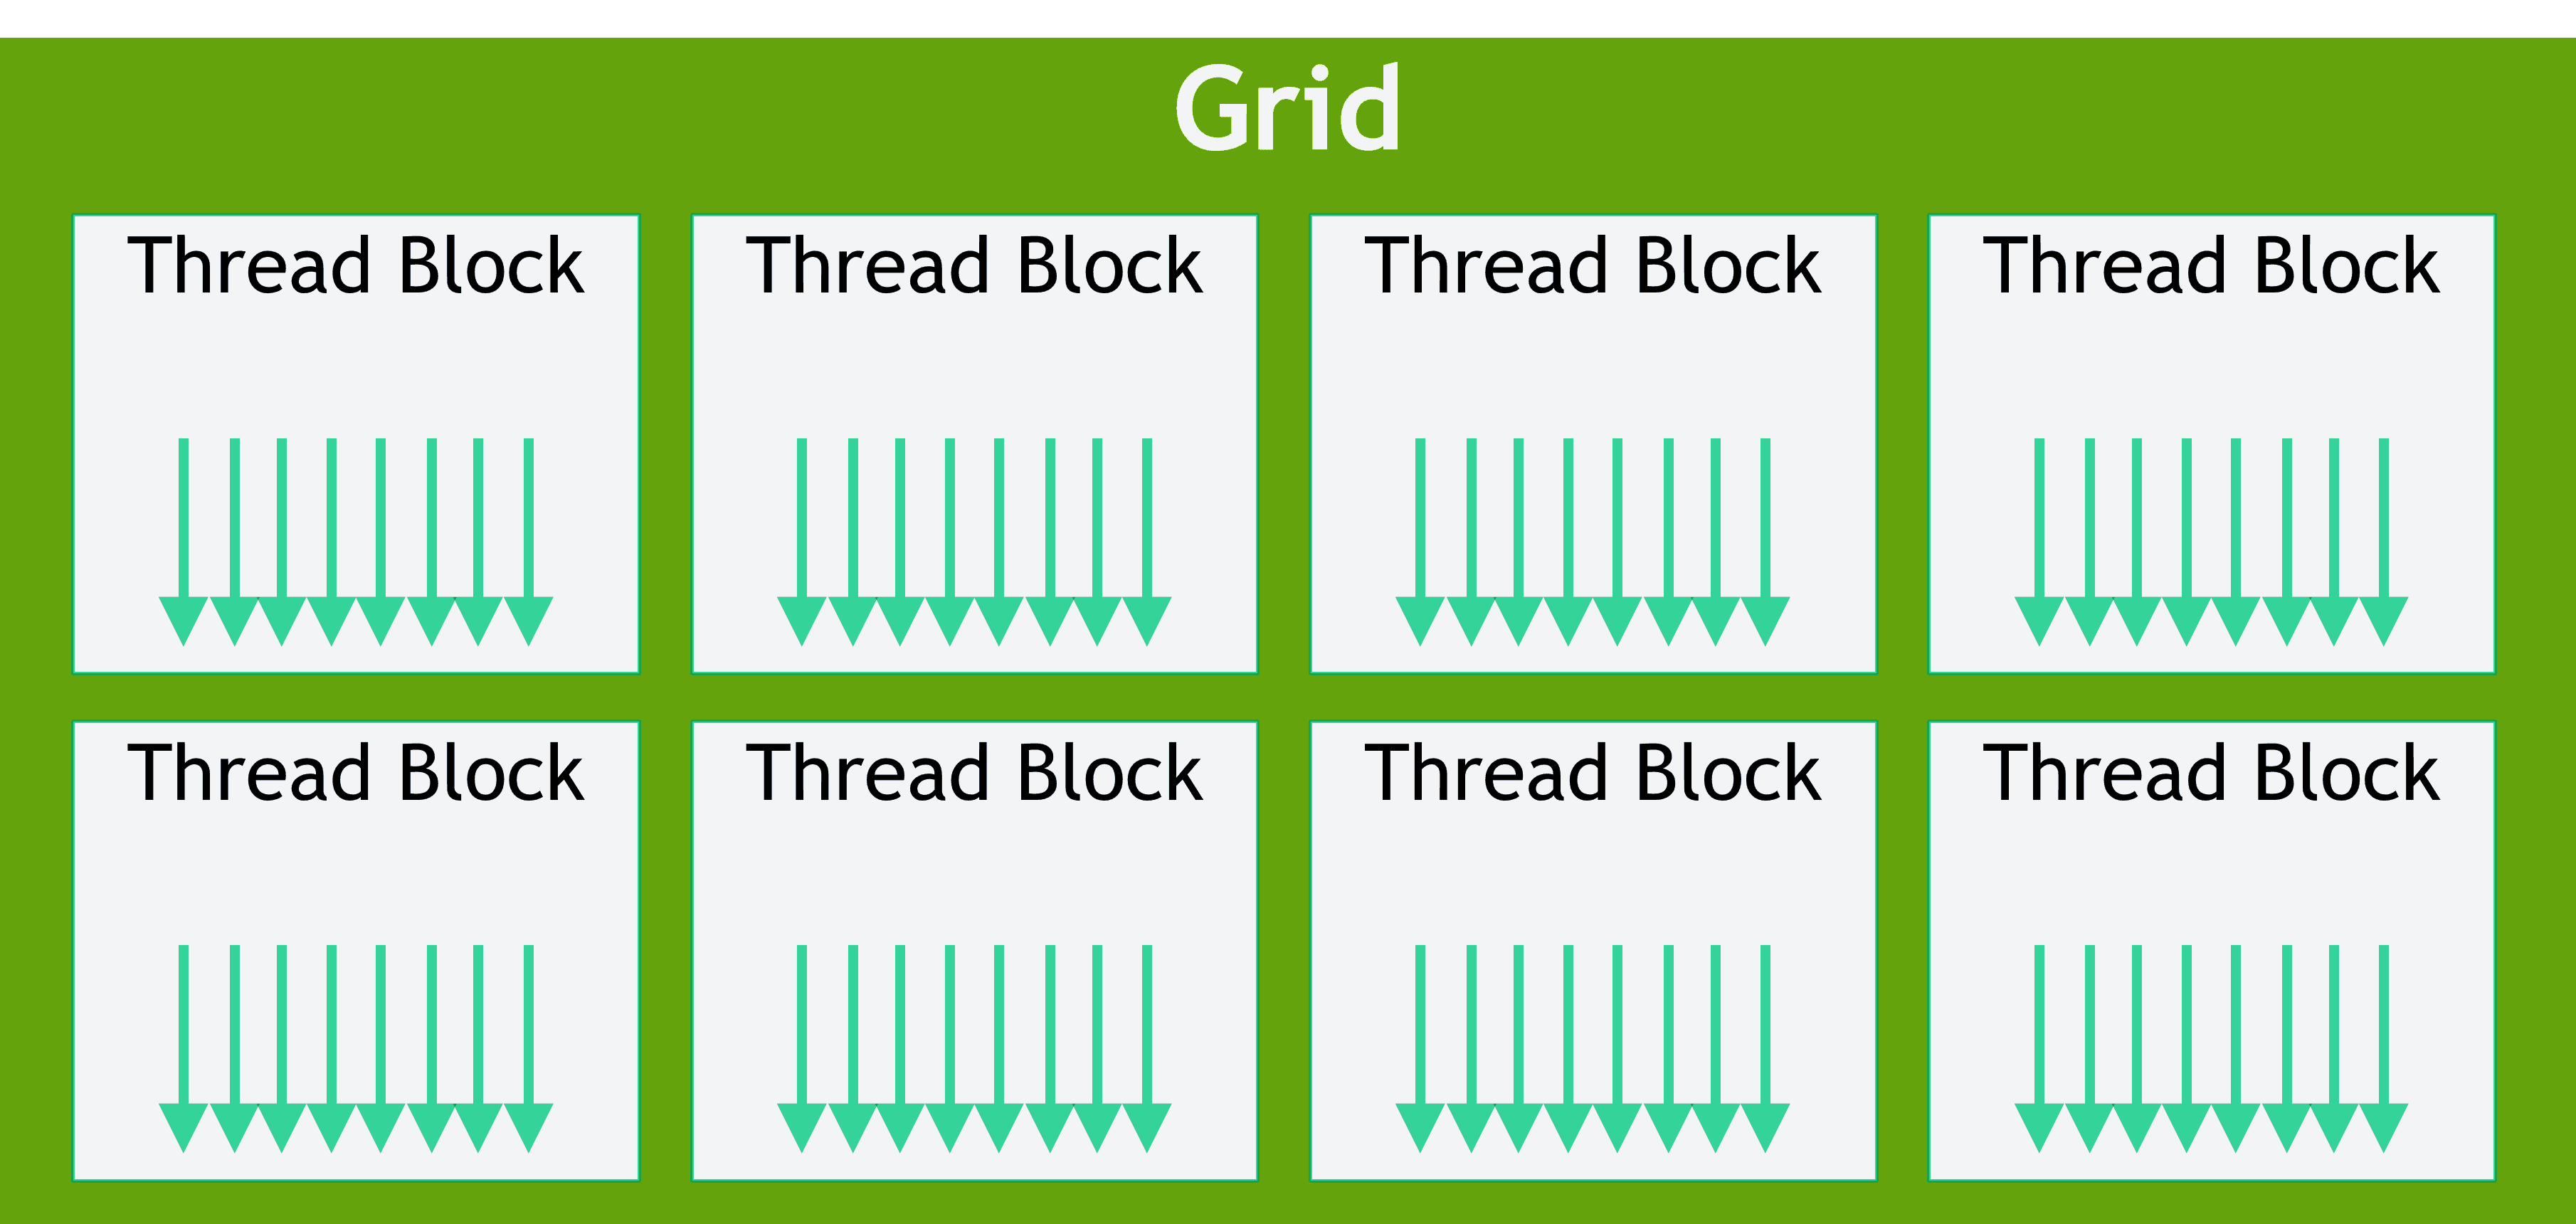
How does a programmer organize and manage millions of threads? CUDA provides an excellent abstraction model:
- Thread: The smallest unit, executes one copy of the kernel function (the function running on the GPU).
- Block: A group of threads (e.g., 128, 256, up to 1024 threads). Important: Threads within the same block can communicate and cooperate via Shared Memory.
- Grid: A group of blocks.
When you launch a kernel, you are telling the GPU:
// Kernel launch syntax
kernel_function<<<GridSize, BlockSize>>>(parameters...);
You are saying: "Create a Grid of GridSize blocks, with each block having BlockSize threads."
Logic Physical Mapping: Block is a logical concept for the programmer. When a block is scheduled onto an SM, the SM divides that block into physical Warps. For example, a block of 1024 threads will be divided into warps.
To let each thread know who and where it is, CUDA provides built-in variables: blockIdx, threadIdx, blockDim, gridDim.
Below is the "Hello World" example of CUDA: vector addition .
// Kernel to add vectors A and B, store in C
__global__ void vectorAdd(float *A, float *B, float *C, int N) {
    // Calculate the global index for this thread
    int idx = blockIdx.x * blockDim.x + threadIdx.x;
    // Ensure the thread does not access out of bounds
    if (idx < N) {
        C[idx] = A[idx] + B[idx];
    }
}
int main() {
    // Skip data initialization, cudaMalloc, cudaMemcpy...
    int N = 1000000; // 1 million elements
    // Use 256 threads per block
    int threadsPerBlock = 256;
    // Calculate the number of blocks needed
    // (N + 255) / 256
    int blocksPerGrid = (N + threadsPerBlock - 1) / threadsPerBlock;
    // Launch kernel!
    vectorAdd<<<blocksPerGrid, threadsPerBlock>>>(A, B, C, N);
    // ...
}
3. The Memory System#
This is the most important part, deciding 90% of performance. As seen with FlashAttention, memory management is everything.
The GPU has a hierarchical memory system. The faster the speed, the smaller the capacity.
| Memory Type | Location | Speed | Scope | Managed By? |
|---|---|---|---|---|
| Registers | On-chip (on SM) | Fastest (~1 cycle) | Per Thread | Compiler (automatic) |
| Shared Memory / L1 | On-chip (on SM) | Very Fast (few cycles) | Per Block | Programmer (__shared__) |
| L2 Cache | On-chip (GPU-wide) | Fast | Entire Grid (GPU) | Hardware (automatic) |
| Global Memory (HBM/VRAM) | Off-chip (on card) | Very Slow (~400-800 cycles) | Entire Grid (GPU) | Programmer (cudaMalloc) |
| Constant Memory | Off-chip (cached on-chip) | Fast (if cache hit) | Entire Grid (GPU) | Programmer (__constant__) |
Most kernels start by reading data from Global Memory (slow) and end by writing data back to it. Optimization is about minimizing Global Memory access by maximizing the use of Shared Memory and Registers.
Two core memory optimization concepts:
- Memory Coalescing: Occurs on Global Memory. When the 32 threads in 1 warp simultaneously access 32 contiguous memory regions (e.g.,
A[idx],A[idx+1], ...,A[idx+31]), the GPU will merge these 32 requests into 1 single memory transaction. This is the ideal scenario, achieving maximum bandwidth. 1 - Bank Conflict: Occurs in Shared Memory. Shared Memory is divided into "banks" (usually 32). If multiple threads in a warp (e.g., 2 threads) simultaneously access different addresses that fall on the same bank, these accesses will be serialized. This kills parallel performance.
PGO: A Methodology for Optimization#
That’s the theory—but how do we actually know where our kernel is slowing down?
We use Profiling-Guided Optimization (PGO): a scientific methodology consisting of Measurement Analysis Hypothesis Modification Re-measurement.
Before diving into tools, we need a mental model for analysis. The most powerful and intuitive model is the Roofline Model.
Roofline Model (GPU)#
The Roofline Model is a chart that shows the theoretical upper limit of performance your kernel can achieve on a given hardware. It helps you immediately answer the question: “Is my kernel limited by computation or by memory bandwidth?”
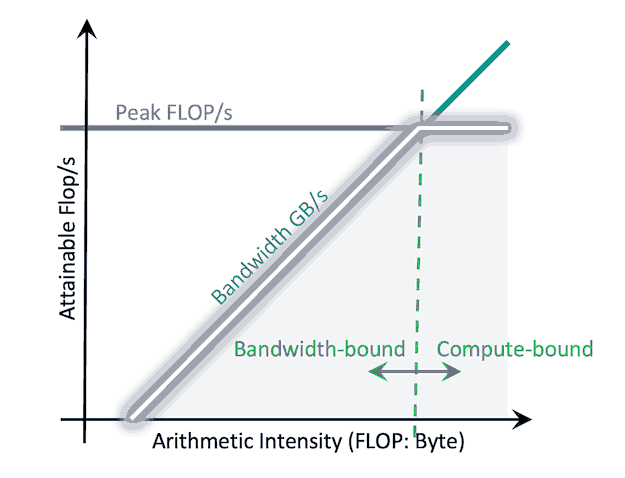
This model has two main axes:
- Y-axis (GFLOPS): Indicates how many billions of floating-point operations per second your kernel performs. Higher is better.
- X-axis (Arithmetic Intensity, AI): The core metric, measured in FLOPs/Byte. It answers: “For every byte of data you read/write from Global Memory, how many operations (FLOPs) do you perform?”
The roof has two parts:
- Horizontal line (Flat Roof): The computational limit (Peak GFLOPS) of your GPU. Your kernel cannot run faster than this limit.
- Diagonal line (Slanted Roof): The memory bandwidth limit (Peak Memory Bandwidth). The kernel’s speed is constrained by how fast it can feed data for computation.
When profiling, your kernel will appear as a point beneath this roof.
- If the point lies below the diagonal line (Memory-bound region): Your bottleneck resembles FlashAttention’s issue—you’re limited by excessive memory reads/writes. To optimize, you must increase Arithmetic Intensity (e.g., using Shared Memory or Kernel Fusion) to move the point rightward.
- If the point lies below the horizontal line (Compute-bound region): You’re using memory efficiently but are now limited by compute speed. To optimize, increase GFLOPS (e.g., leverage Tensor Cores or use half instead of float operations).
The Roofline Model gives you a clear compass for identifying what to optimize.
NVIDIA Nsight#
To gather this data and plot the Roofline chart, we use the NVIDIA Nsight suite:
- Nsight Systems: Provides the macro view. It shows a complete timeline of your application—what the CPU and GPU are doing, how long
cudaMemcpy(data transfer) takes, and when each kernel runs. It helps identify which kernel to optimize or whether you’re I/O-bound. - Nsight Compute: Provides the micro view. It dives inside a specific kernel, telling you precisely whether it’s memory-bound or compute-bound, its “occupancy” (latency hiding capability), cache hit/miss rates, uncoalesced accesses, and more.
After profiling, you can start forming hypotheses:
-
If Memory-bound (Bandwidth-limited):
- Hypothesis: I have uncoalesced memory access.
Action: Adjustidxso that 32 threads access contiguous addresses. - Hypothesis: I repeatedly load the same data from Global Memory.
Action: Load that data into Shared Memory once, and let the entire block reuse it (as FlashAttention does!).
- Hypothesis: I have uncoalesced memory access.
-
If Compute-bound (Computation-limited):
- Hypothesis: I’m using unnecessary
double(64-bit) operations.
Action: Switch tofloat(32-bit). - Hypothesis: I’m performing matrix multiplications without Tensor Cores.
Action: UsecuBLASor program withhalf(16-bit) /tf32to activate Tensor Cores.
- Hypothesis: I’m using unnecessary
-
If Latency-bound (Low Occupancy):
- Hypothesis: My kernel doesn’t have enough resident warps to hide latency. This could be due to excessive register or shared memory usage per block.
Action: Reduce resource usage or adjustBlockSizeto increase the number of active blocks per SM.
- Hypothesis: My kernel doesn’t have enough resident warps to hide latency. This could be due to excessive register or shared memory usage per block.
Conclusion#
Learning CUDA is a mindset-changing journey. It's not just about learning a new API, but learning to design algorithms for parallel hardware.
From the slow std::sort to the speedy thrust::sort, from standard self-attention to FlashAttention, it's all a result of understanding the "machine" you're running on and respecting its rules—especially the rules of memory.
Hopefully, this article has given you an overview of the exciting world of GPU computing.
views
— views
Nguyen Xuan Hoa
nguyenxuanhoakhtn@gmail.com